Stock market trends and charts application
Trend line. Charting software. Technical analysis.
Statistical learning stock market time series trends.
Trend handling protocols for distilling time series data
USPTO Track 1 Patent Application / patent pending
Dr. Asoka Korale
The AEON Law firm in Seattle, Washington,
Strategic advisor Adam Philipp
Patent attorney Jonathan Olson
Contact investors and venture capital
It all begins with an idea.
Application in the Stock Market – Charting, Analysis, Risk, Trading
Trading platform
Time series
Forecasting
Risk
Market intelligence
Data mining method
Data base time series patterns
Statistical learning trends
Analysis of trends
Time series
Moving average
Linear Regression
Linear Regression
Slope
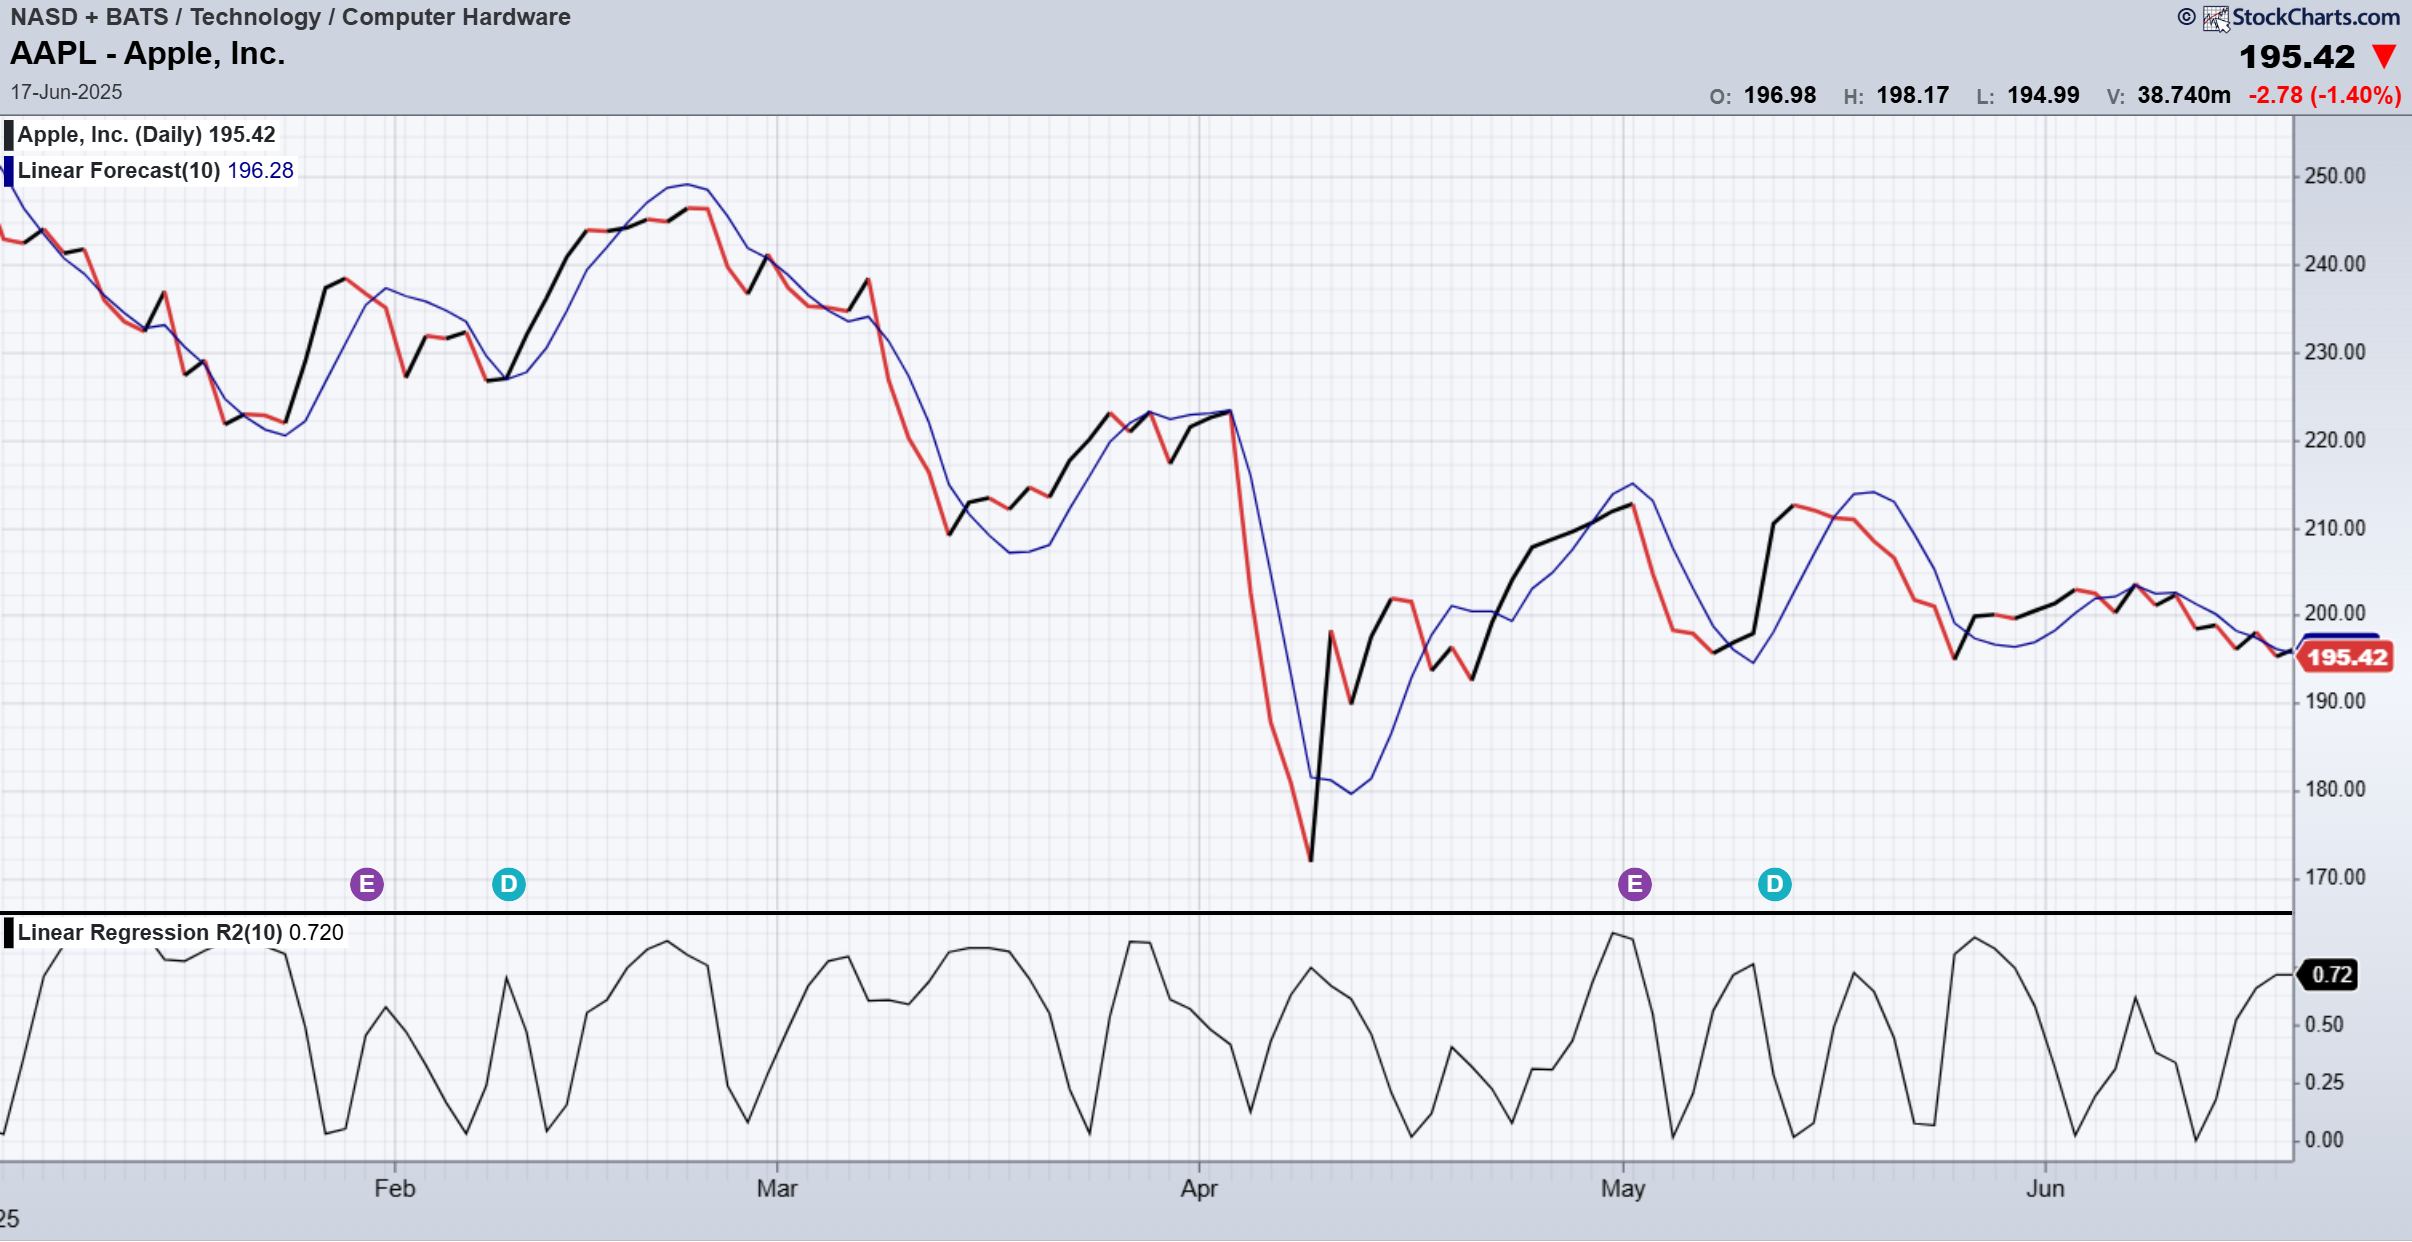
R square
Trend score
Trend risk
Trend return
Introduction
It all begins with an idea.
Rolling window linear regression
R squared - Rolling window linear regression
Slope - Rolling window linear regression
Linear Regression
Moving Average
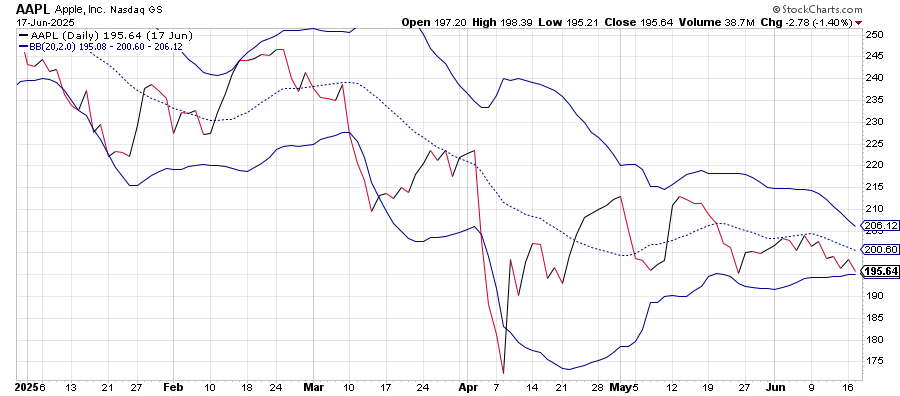
Bollinger Band
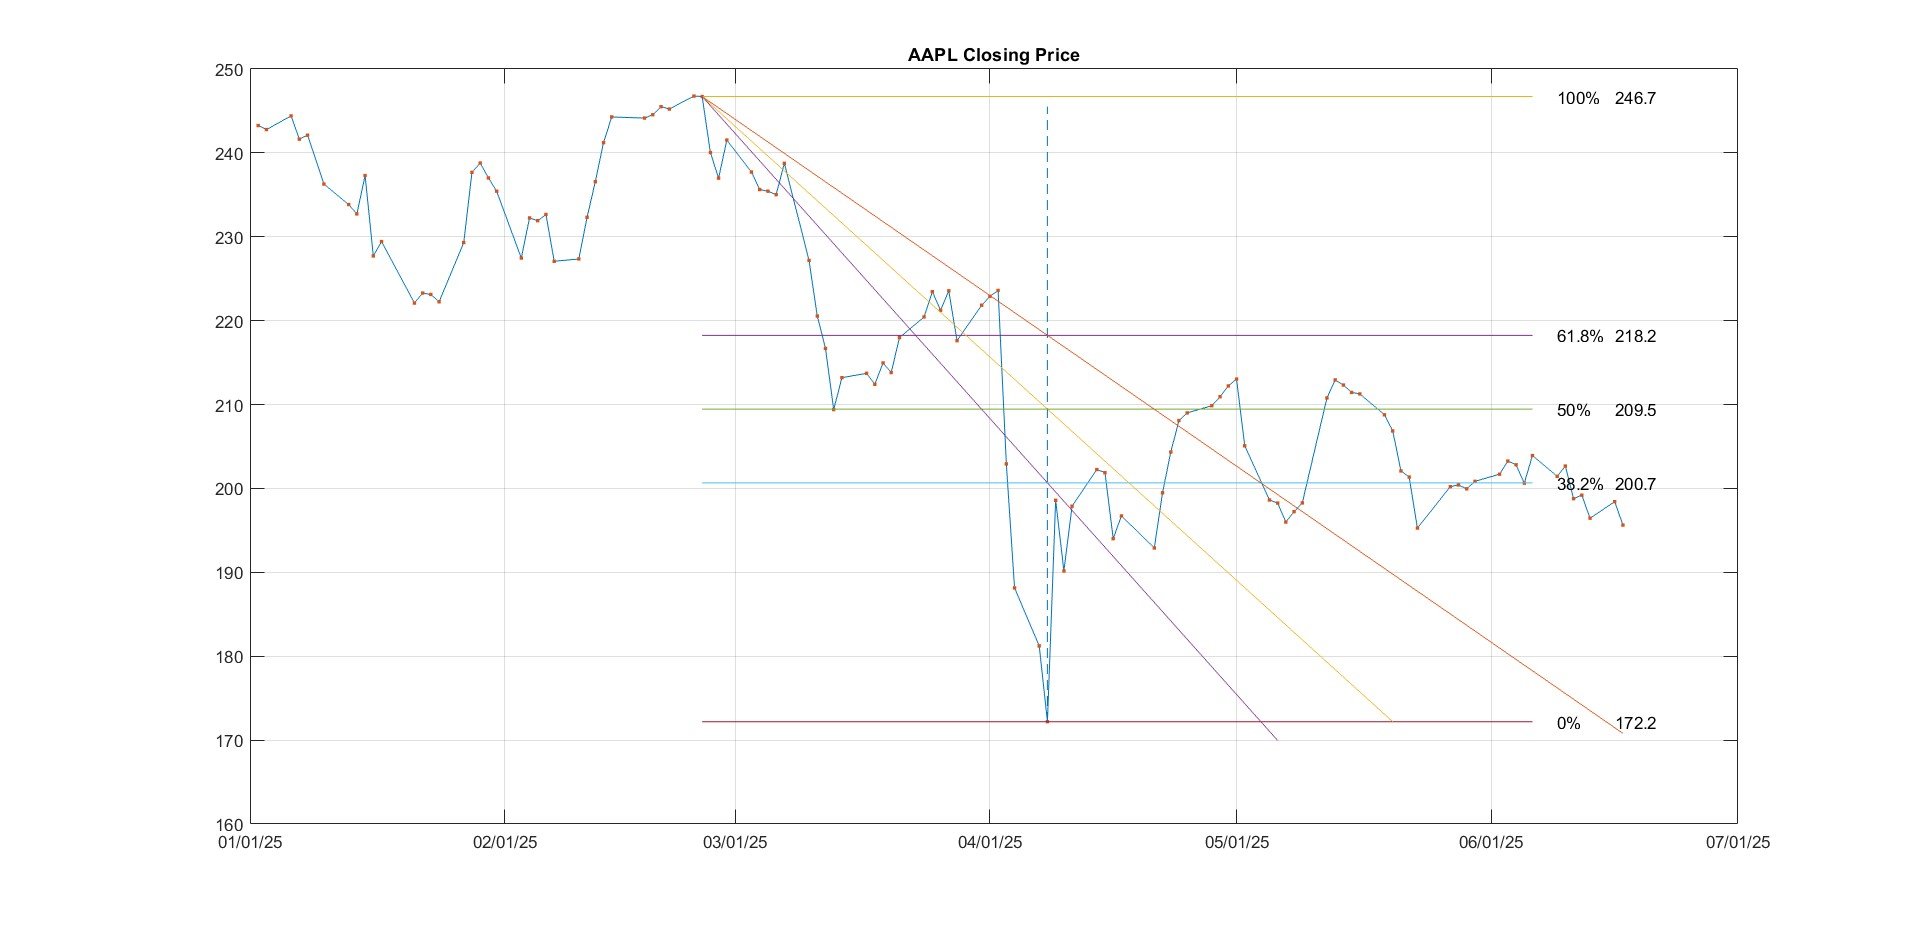
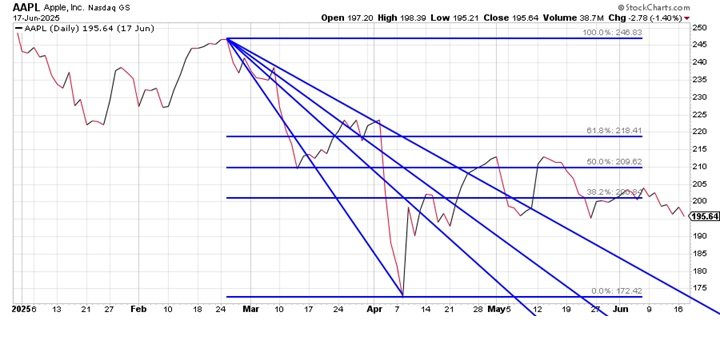
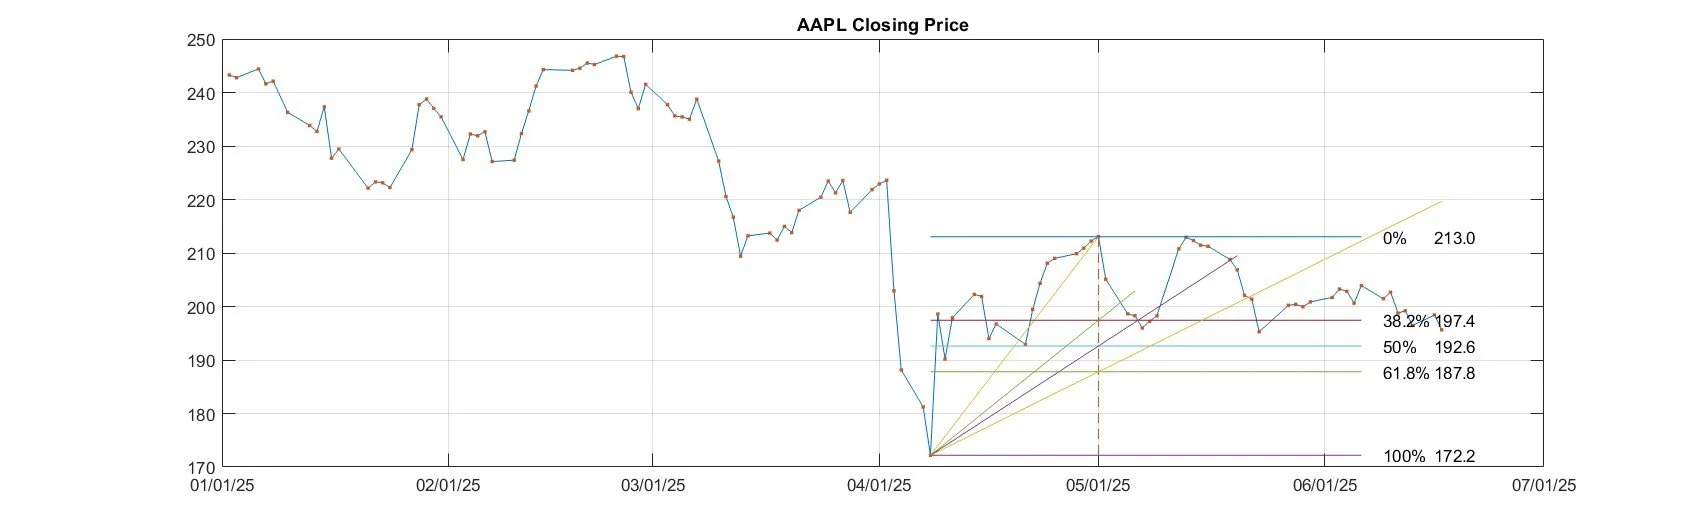
Fibonacci fan
Fibonacci retracement
Rolling Window Linear Regression
It all begins with an idea.

Risk
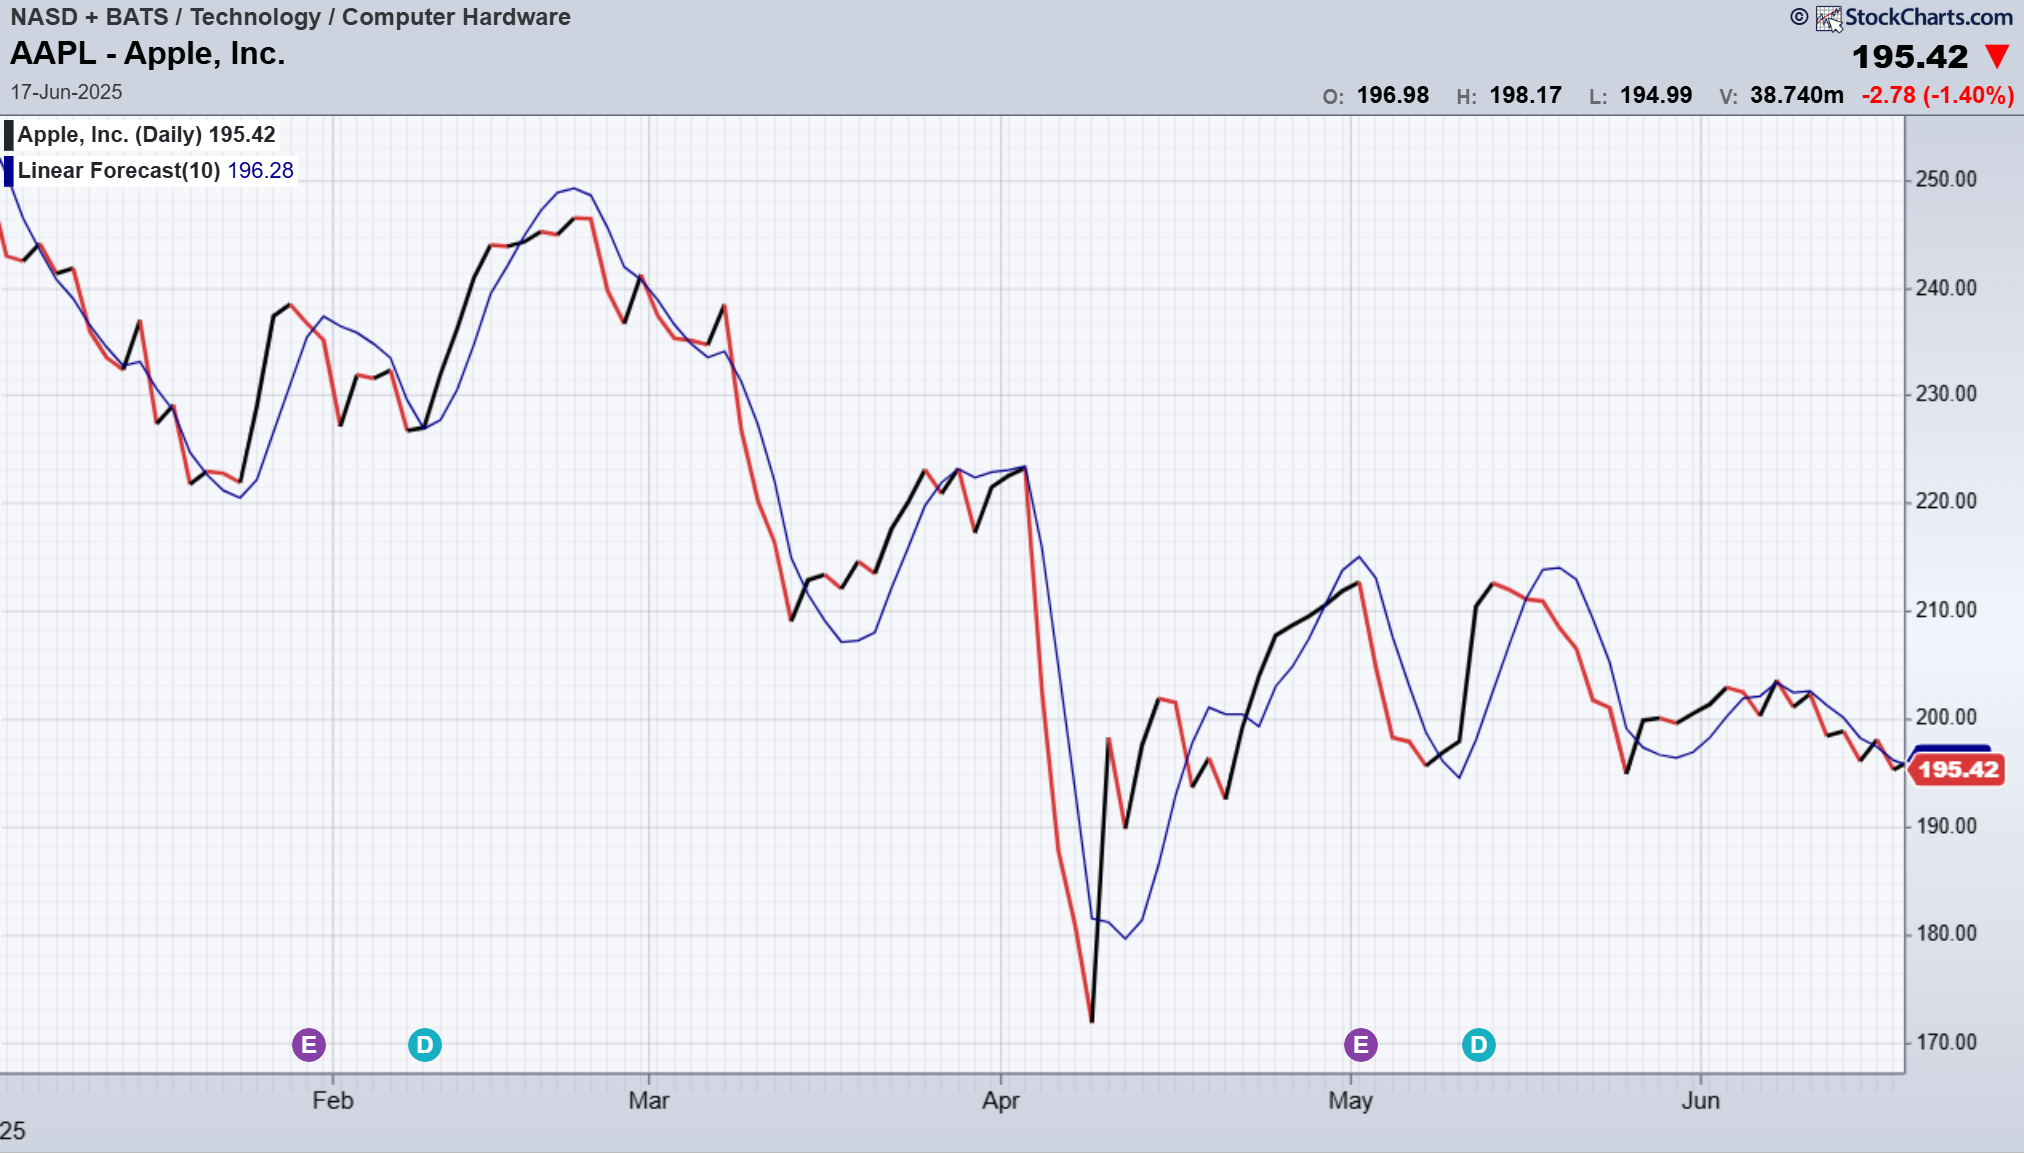
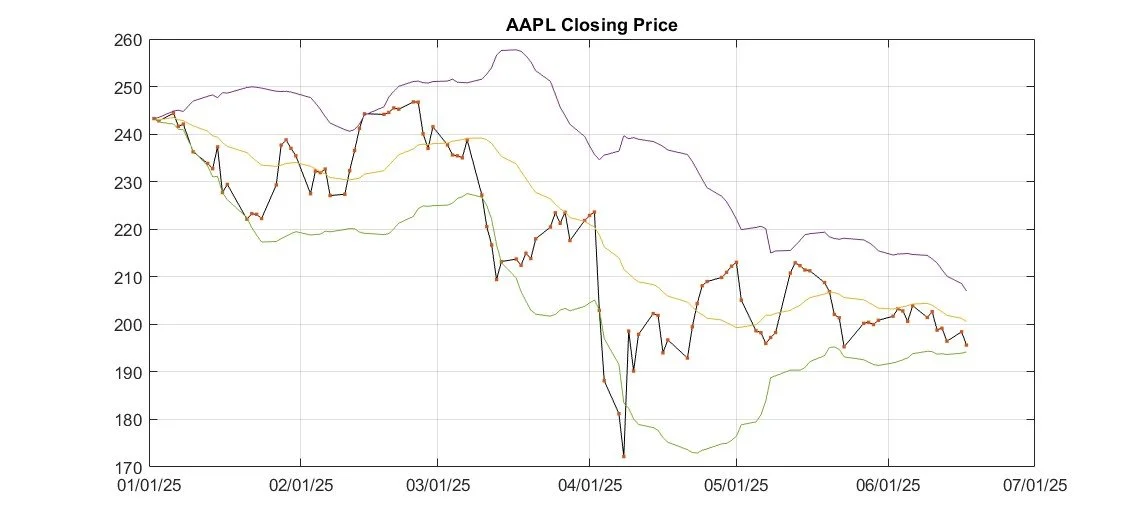
Trend Line
Linear Regression
(Rolling window length 10)
Time period 1/02/2025 – 6/17/2025
R Squared - Rolling Window Linear Regression
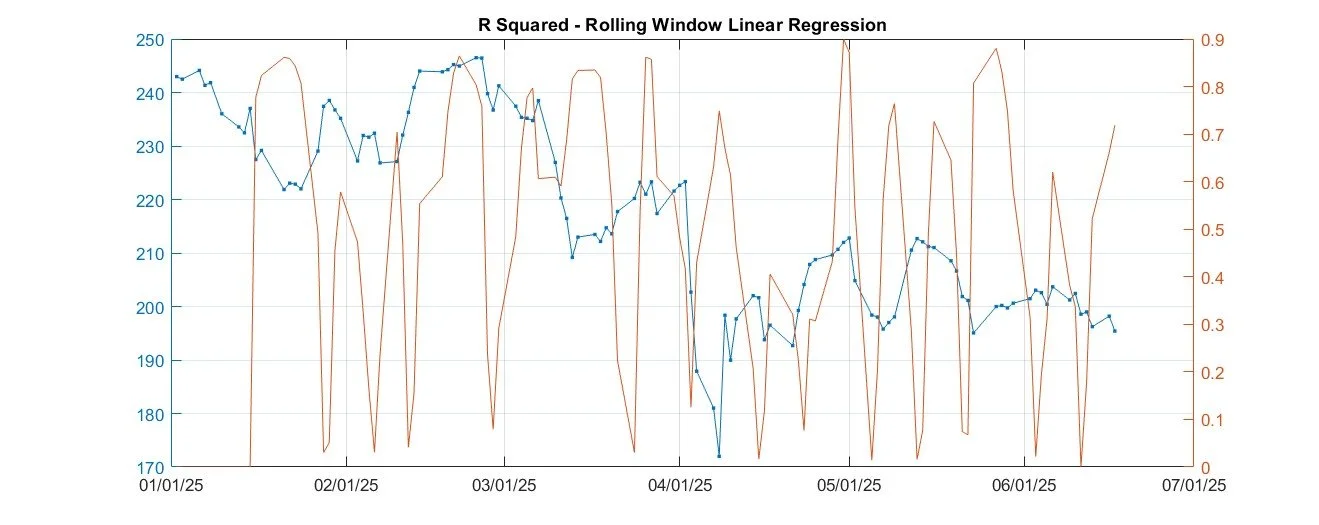
R Squared
Linear regression
(Rolling window length 10)
Time period 1/02/2025 – 6/17/2025
Slope - Rolling Window Linear Regression
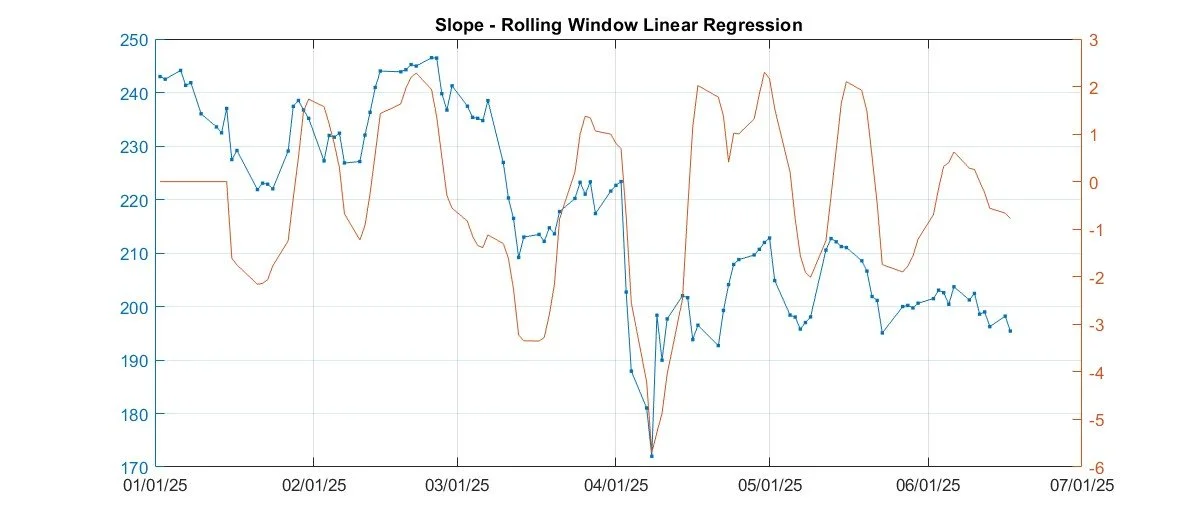
Risk / Return
Slope trend line
Linear Regression
(Rolling window length 10)
Time period 1/02/2025 – 6/17/2025

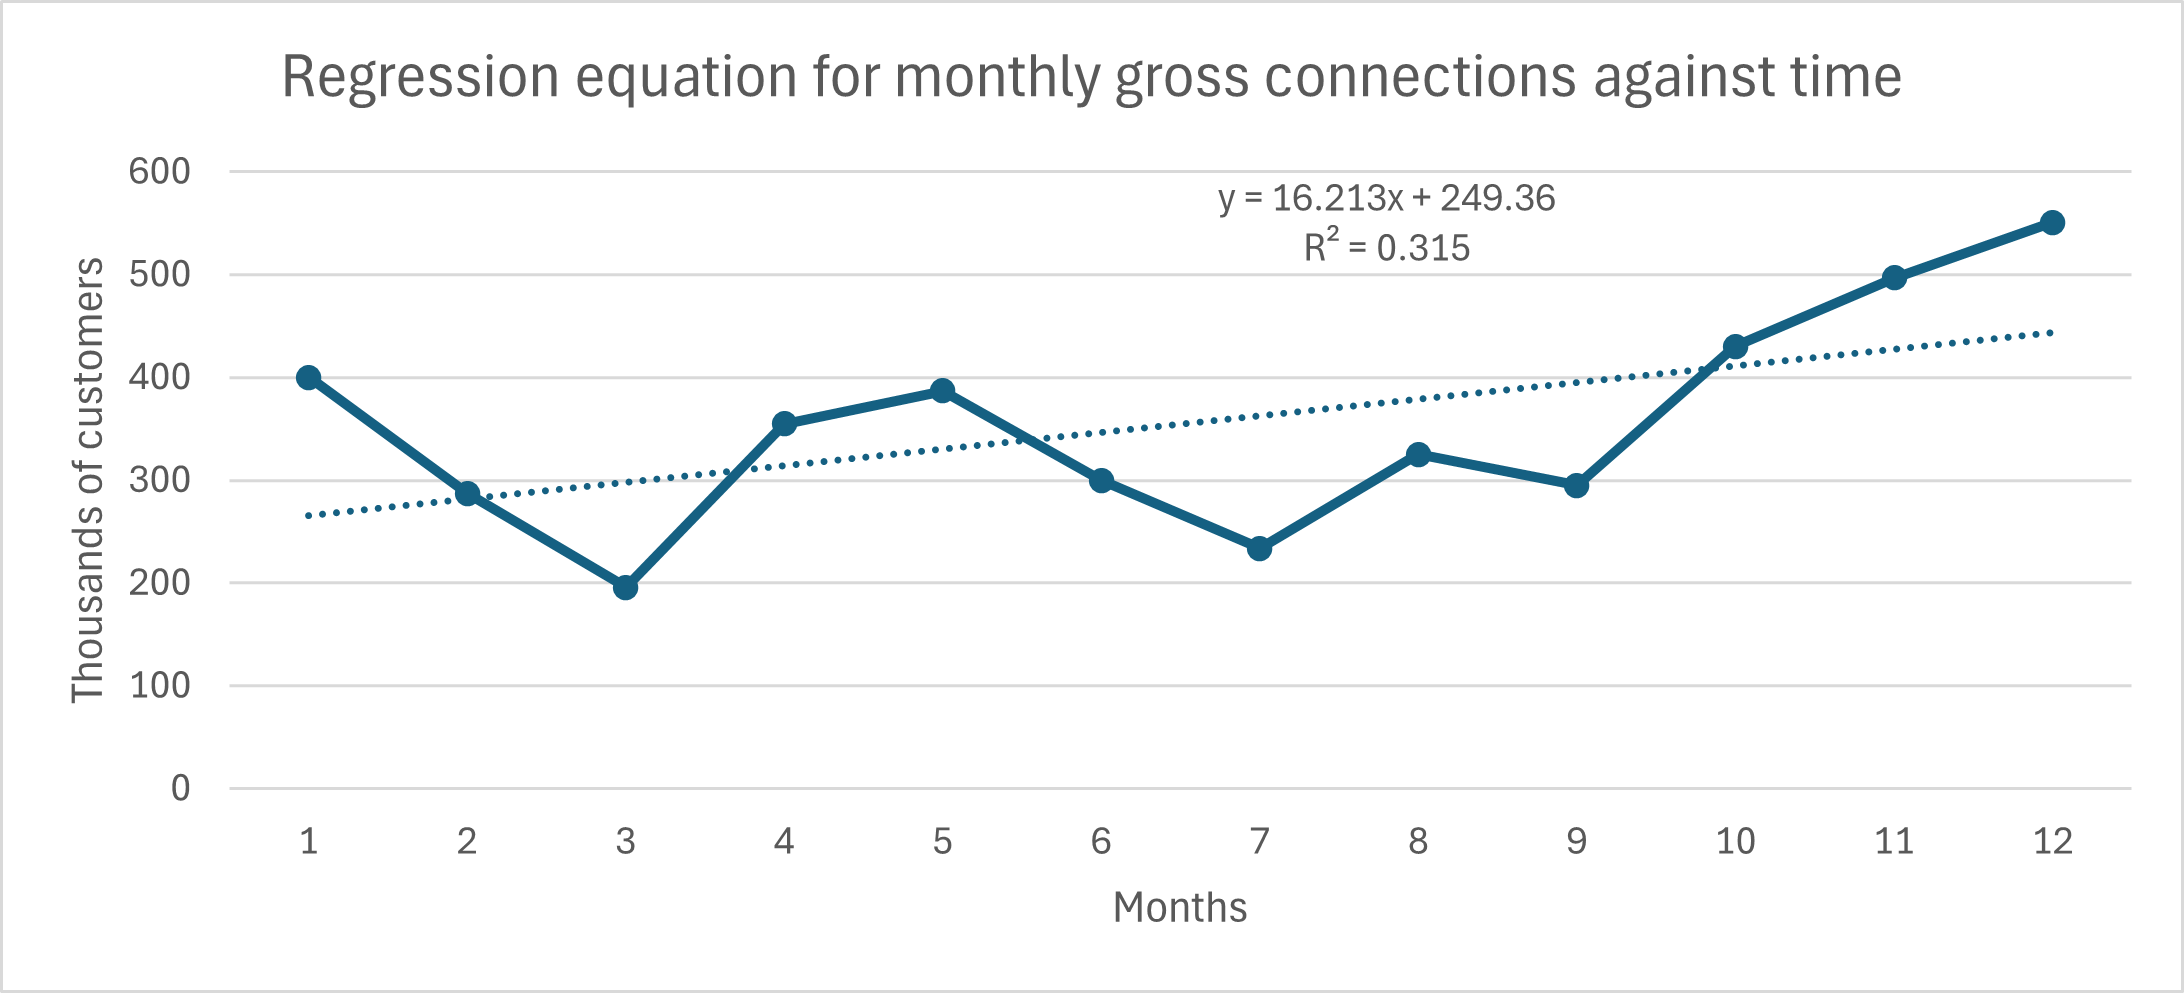
Regression Trendline
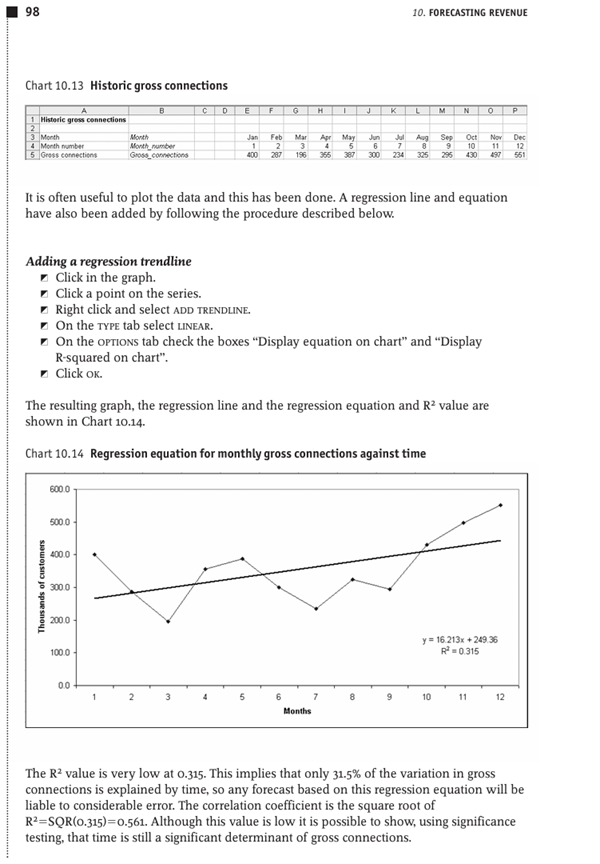
Reference: Guide to Business Modeling, John Tennent and Graham Friend, The Economist in association with Profile Books Ltd., 2005.
ISBN-10: 1-86197-915-0
ISBN-13: 978-1-86197-915-5

Moving Average Trendline

(MS Excel) Trendline - Moving Average.
Gross connections by quarter
Year 2001 2002 2003 2004
Spring 24 48 68 107
Summer 44 66 85 125
Autumn 61 91 100 138
Winter 79 105 125 159
Reference: Guide to Business Modeling, John Tennent and Graham Friend, The Economist in association with Profile Books Ltd., 2005.
ISBN-10: 1-86197-915-0
ISBN-13: 978-1-86197-915-5
Bollinger Band
•Simple moving average, window length 20
•Bandwidth +/- 2 standard deviations
•Time period 1/02/2025 – 6/17/2025