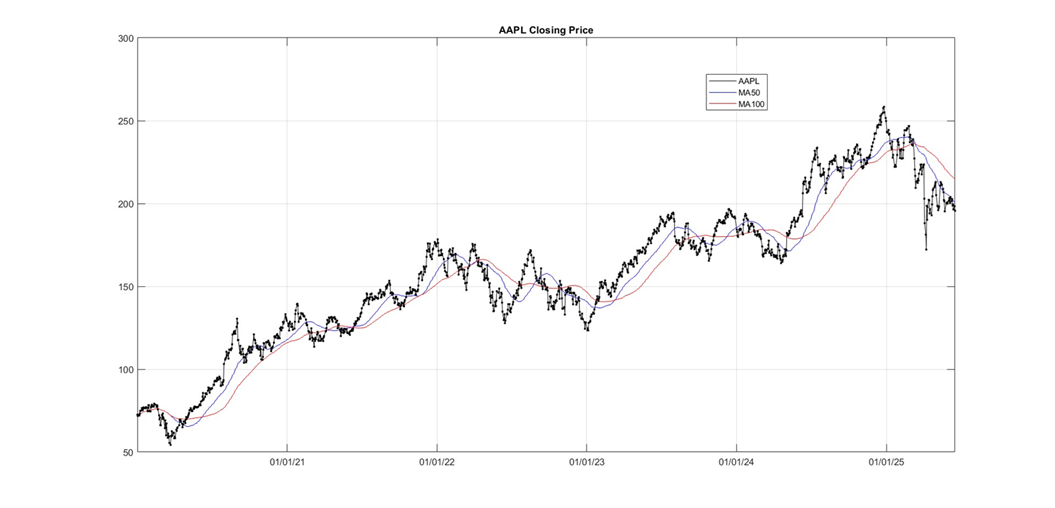
Stock and moving average trend comparison
6/17/2025: AAPL 195.64, MA(50) 201.35, MA(100) 215.00
Simple moving average 50 days and 100 days.
Time period 1/2/2020 - 6/17/2025.
6/17/2025: AAPL 195.64, MA(50) 201.35, MA(100) 215.00
Simple moving average 50 days and 100 days.
Time period 1/2/2020 - 6/17/2025.